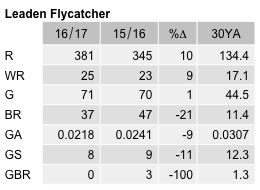
Leaden Flycatcher
Myiagra rubecula
ABR description
The following is extracted from the Annual Bird Report for the twelve months to June 2017.
Common, breeding summer migrant
Usually recorded in the woodlands around Canberra suburbs.
General: Reporting rate 2.8% is down 7% on last year, down 36% on the 10YA and down 44% on the 30YA. The reporting rate has declined from 6.9% in 1998 to its lowest value ever of 2.8% in 2017. No winter records with spring 43%, summer 52% and autumn 5%. Max 10/30 Oct Kambah Pool GrI16 (VeP1), average 2.3 and median 2. Earliest sighting 1/29 Aug Macquarie (CnM1), and latest 1/9 May E Tallaganda Lane GrM10 (TwP1). Breeding records: earliest di/25 Oct Wamboin GrQ13 (McD1) and latest dy/3 Feb Federal Hwy Gurney Rest Area GrR06 (AnF1).
GBS: The abundance value for this species is erratic and varies widely from year to year. At 0.0218 it is down 9% on last year, 22% on 10YA and 29% on 30YA. Maximum and earliest record 8/4wk Sep Red Hill (WaR4) and latest 2/2wk Mar Campbell (LjT1).
Abundance
Abundance is the average number of birds of that species per survey. Where the species was observed (presence recorded) but the number of birds seen was not recorded, this is treated as a count of zero.
Abundance by year
This chart shows the abundance of Leaden Flycatcher between 1982 and 2017. 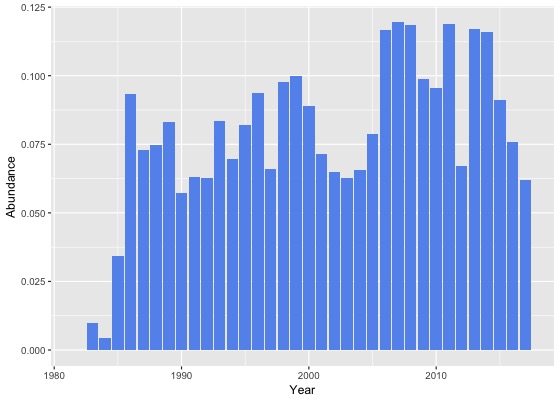
Abundance by month
This chart shows the monthly abundance of Leaden Flycatcher. The blue lines show the abundance for the twelve months to June 2017 and the bars show the average abundance for the period 1982 to 2017. 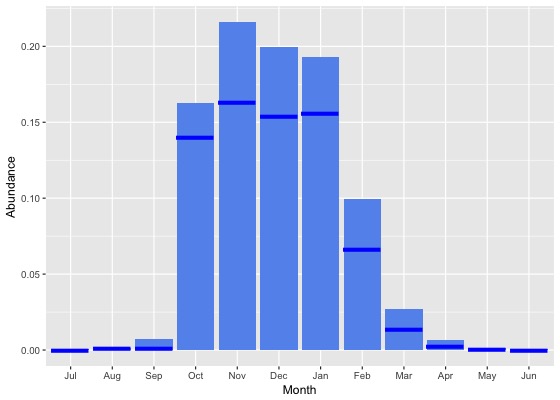
Abundance by season
This chart shows the seasonal abundance of Leaden Flycatcher. The blue lines show the seasonal abundance for the twelve months to June 2017 and the bars show the average seasonal abundance for the period 1982 to 2017. 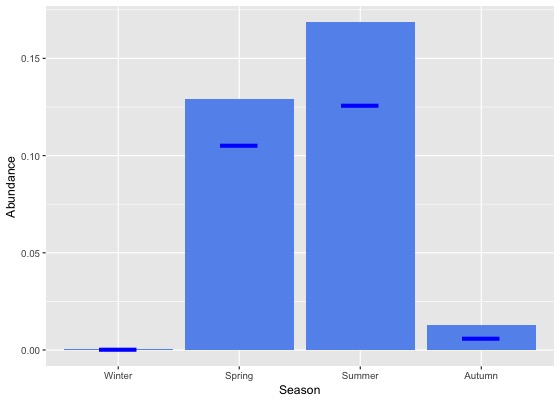
Abundance data
| Month | Season | ||||||||||||||||||
|---|---|---|---|---|---|---|---|---|---|---|---|---|---|---|---|---|---|---|---|
| Period | Jul | Aug | Sep | Oct | Nov | Dec | Jan | Feb | Mar | Apr | May | Jun | Winter | Spring | Summer | Autumn | All | ||
| All years | |||||||||||||||||||
| All | 0.0 | 0.0 | 0.0 | 0.2 | 0.2 | 0.2 | 0.2 | 0.1 | 0.0 | 0.0 | 0.0 | 0.0 | 0.0 | 0.1 | 0.2 | 0.0 | 0.1 | ||
| Previous years | |||||||||||||||||||
| All previous years | 0.0 | 0.0 | 0.0 | 0.2 | 0.2 | 0.2 | 0.2 | 0.1 | 0.0 | 0.0 | 0.0 | 0.0 | 0.0 | 0.1 | 0.2 | 0.0 | 0.1 | ||
| Previous 30 years | 0.0 | 0.0 | 0.0 | 0.2 | 0.2 | 0.2 | 0.2 | 0.1 | 0.0 | 0.0 | 0.0 | 0.0 | 0.0 | 0.1 | 0.2 | 0.0 | 0.1 | ||
| Previous 20 years | 0.0 | 0.0 | 0.0 | 0.2 | 0.2 | 0.2 | 0.2 | 0.1 | 0.0 | 0.0 | 0.0 | 0.0 | 0.0 | 0.1 | 0.2 | 0.0 | 0.1 | ||
| 10 year groups | |||||||||||||||||||
| [2007,2017) | 0.0 | 0.0 | 0.0 | 0.2 | 0.3 | 0.2 | 0.2 | 0.1 | 0.0 | 0.0 | 0.0 | 0.0 | 0.0 | 0.2 | 0.2 | 0.0 | 0.1 | ||
| [1997,2007) | 0.0 | 0.0 | 0.0 | 0.1 | 0.2 | 0.2 | 0.2 | 0.1 | 0.0 | 0.0 | 0.0 | 0.0 | 0.0 | 0.1 | 0.2 | 0.0 | 0.1 | ||
| [1987,1997) | 0.0 | 0.0 | 0.0 | 0.1 | 0.2 | 0.2 | 0.2 | 0.1 | 0.1 | 0.0 | 0.0 | 0.0 | 0.0 | 0.1 | 0.2 | 0.0 | 0.1 | ||
| 5 year groups | |||||||||||||||||||
| [2012,2017) | 0.0 | 0.0 | 0.0 | 0.2 | 0.2 | 0.2 | 0.2 | 0.1 | 0.0 | 0.0 | 0.0 | 0.0 | 0.0 | 0.1 | 0.2 | 0.0 | 0.1 | ||
| [2007,2012) | 0.0 | 0.0 | 0.0 | 0.2 | 0.3 | 0.2 | 0.2 | 0.1 | 0.0 | 0.0 | 0.0 | 0.0 | 0.0 | 0.2 | 0.2 | 0.0 | 0.1 | ||
| [2002,2007) | 0.0 | 0.0 | 0.0 | 0.1 | 0.2 | 0.2 | 0.2 | 0.1 | 0.0 | 0.0 | 0.0 | 0.0 | 0.0 | 0.1 | 0.2 | 0.0 | 0.1 | ||
| [1997,2002) | 0.0 | 0.0 | 0.0 | 0.1 | 0.2 | 0.2 | 0.3 | 0.1 | 0.0 | 0.0 | 0.0 | 0.0 | 0.0 | 0.1 | 0.2 | 0.0 | 0.1 | ||
| [1992,1997) | 0.0 | 0.0 | 0.0 | 0.1 | 0.2 | 0.2 | 0.2 | 0.2 | 0.1 | 0.0 | 0.0 | 0.0 | 0.0 | 0.1 | 0.2 | 0.0 | 0.1 | ||
| [1987,1992) | 0.0 | 0.0 | 0.0 | 0.1 | 0.2 | 0.2 | 0.2 | 0.1 | 0.1 | 0.0 | 0.0 | 0.0 | 0.0 | 0.1 | 0.2 | 0.0 | 0.1 | ||
| Year | |||||||||||||||||||
| 2017 | 0.0 | 0.0 | 0.0 | 0.1 | 0.2 | 0.2 | 0.2 | 0.1 | 0.0 | 0.0 | 0.0 | 0.0 | 0.0 | 0.1 | 0.1 | 0.0 | 0.1 | ||
| 2016 | 0.0 | 0.0 | 0.0 | 0.1 | 0.2 | 0.3 | 0.2 | 0.1 | 0.0 | 0.0 | 0.0 | 0.0 | 0.0 | 0.1 | 0.2 | 0.0 | 0.1 | ||
| 2015 | 0.0 | 0.0 | 0.0 | 0.2 | 0.2 | 0.2 | 0.2 | 0.1 | 0.0 | 0.0 | 0.0 | 0.0 | 0.0 | 0.1 | 0.2 | 0.0 | 0.1 | ||
| 2014 | 0.0 | 0.0 | 0.0 | 0.3 | 0.3 | 0.2 | 0.2 | 0.1 | 0.0 | 0.0 | 0.0 | 0.0 | 0.0 | 0.2 | 0.2 | 0.0 | 0.1 | ||
| 2013 | 0.0 | 0.0 | 0.0 | 0.2 | 0.3 | 0.2 | 0.3 | 0.1 | 0.0 | 0.0 | 0.0 | 0.0 | 0.0 | 0.2 | 0.2 | 0.0 | 0.1 | ||
| 2012 | 0.0 | 0.0 | 0.0 | 0.1 | 0.1 | 0.2 | 0.1 | 0.1 | 0.0 | 0.0 | 0.0 | 0.0 | 0.0 | 0.1 | 0.1 | 0.0 | 0.1 | ||
| 2011 | 0.0 | 0.0 | 0.0 | 0.2 | 0.2 | 0.2 | 0.3 | 0.1 | 0.0 | 0.0 | 0.0 | 0.0 | 0.0 | 0.2 | 0.2 | 0.0 | 0.1 | ||
| 2010 | 0.0 | 0.0 | 0.0 | 0.2 | 0.2 | 0.2 | 0.2 | 0.0 | 0.0 | 0.0 | 0.0 | 0.0 | 0.0 | 0.2 | 0.2 | 0.0 | 0.1 | ||
| 2009 | 0.0 | 0.0 | 0.0 | 0.2 | 0.2 | 0.2 | 0.2 | 0.1 | 0.0 | 0.0 | 0.0 | 0.0 | 0.0 | 0.2 | 0.2 | 0.0 | 0.1 | ||
| 2008 | 0.0 | 0.0 | 0.0 | 0.3 | 0.3 | 0.2 | 0.3 | 0.1 | 0.0 | 0.0 | 0.0 | 0.0 | 0.0 | 0.2 | 0.2 | 0.0 | 0.1 | ||
| 2007 | 0.0 | 0.0 | 0.0 | 0.1 | 0.6 | 0.2 | 0.2 | 0.2 | 0.0 | 0.0 | 0.0 | 0.0 | 0.0 | 0.2 | 0.2 | 0.0 | 0.1 | ||
| 2006 | 0.0 | 0.0 | 0.0 | 0.3 | 0.3 | 0.2 | 0.3 | 0.1 | 0.0 | 0.0 | 0.0 | 0.0 | 0.0 | 0.2 | 0.2 | 0.0 | 0.1 | ||
| 2005 | 0.0 | 0.0 | 0.0 | 0.1 | 0.2 | 0.3 | 0.1 | 0.2 | 0.0 | 0.0 | 0.0 | 0.0 | 0.0 | 0.1 | 0.2 | 0.0 | 0.1 | ||
| 2004 | 0.0 | 0.0 | 0.0 | 0.1 | 0.2 | 0.1 | 0.2 | 0.2 | 0.0 | 0.0 | 0.0 | 0.0 | 0.0 | 0.1 | 0.2 | 0.0 | 0.1 | ||
| 2003 | 0.0 | 0.0 | 0.0 | 0.1 | 0.2 | 0.2 | 0.2 | 0.0 | 0.0 | 0.0 | 0.0 | 0.0 | 0.0 | 0.1 | 0.1 | 0.0 | 0.1 | ||
| 2002 | 0.0 | 0.0 | 0.0 | 0.0 | 0.2 | 0.2 | 0.1 | 0.0 | 0.0 | 0.0 | 0.0 | 0.0 | 0.0 | 0.1 | 0.1 | 0.0 | 0.1 | ||
| 2001 | 0.0 | 0.0 | 0.0 | 0.1 | 0.2 | 0.2 | 0.2 | 0.2 | 0.0 | 0.0 | 0.0 | 0.0 | 0.0 | 0.1 | 0.2 | 0.0 | 0.1 | ||
| 2000 | 0.0 | 0.0 | 0.0 | 0.0 | 0.2 | 0.2 | 0.3 | 0.1 | 0.0 | 0.0 | 0.0 | 0.0 | 0.0 | 0.1 | 0.2 | 0.0 | 0.1 | ||
| 1999 | 0.0 | 0.0 | 0.0 | 0.2 | 0.3 | 0.3 | 0.3 | 0.1 | 0.0 | 0.0 | 0.0 | 0.0 | 0.0 | 0.2 | 0.2 | 0.0 | 0.1 | ||
| 1998 | 0.1 | 0.0 | 0.0 | 0.2 | 0.2 | 0.3 | 0.3 | 0.0 | 0.0 | 0.0 | 0.0 | 0.0 | 0.0 | 0.1 | 0.2 | 0.0 | 0.1 | ||
| 1997 | 0.0 | 0.0 | 0.0 | 0.1 | 0.3 | 0.2 | 0.1 | 0.1 | 0.0 | 0.0 | 0.0 | 0.0 | 0.0 | 0.1 | 0.1 | 0.0 | 0.1 | ||
| 1996 | 0.0 | 0.0 | 0.0 | 0.2 | 0.2 | 0.4 | 0.0 | 0.1 | 0.0 | 0.0 | 0.0 | 0.0 | 0.0 | 0.2 | 0.2 | 0.0 | 0.1 | ||
| 1995 | 0.0 | 0.0 | 0.0 | 0.1 | 0.2 | 0.1 | 0.2 | 0.2 | 0.3 | 0.0 | 0.0 | 0.0 | 0.0 | 0.1 | 0.2 | 0.1 | 0.1 | ||
| 1994 | 0.0 | 0.0 | 0.0 | 0.2 | 0.1 | 0.3 | 0.2 | 0.2 | 0.0 | 0.0 | 0.0 | 0.0 | 0.0 | 0.1 | 0.2 | 0.0 | 0.1 | ||
| 1993 | 0.0 | 0.0 | 0.0 | 0.1 | 0.3 | 0.2 | 0.3 | 0.2 | 0.1 | 0.0 | 0.0 | 0.0 | 0.0 | 0.1 | 0.2 | 0.0 | 0.1 | ||
| 1992 | 0.0 | 0.0 | 0.0 | 0.0 | 0.3 | 0.1 | 0.0 | 0.3 | 0.1 | 0.0 | 0.0 | 0.0 | 0.0 | 0.1 | 0.1 | 0.0 | 0.1 | ||
| 1991 | 0.0 | 0.0 | 0.0 | 0.1 | 0.1 | 0.2 | 0.1 | 0.2 | 0.1 | 0.0 | 0.0 | 0.0 | 0.0 | 0.1 | 0.2 | 0.0 | 0.1 | ||
| 1990 | 0.0 | 0.0 | 0.0 | 0.1 | 0.2 | 0.2 | 0.1 | 0.2 | 0.0 | 0.0 | 0.0 | 0.0 | 0.0 | 0.1 | 0.2 | 0.0 | 0.1 | ||
| 1989 | 0.0 | 0.0 | 0.0 | 0.2 | 0.2 | 0.2 | 0.2 | 0.1 | 0.0 | 0.0 | 0.0 | 0.0 | 0.0 | 0.1 | 0.2 | 0.0 | 0.1 | ||
| 1988 | 0.0 | 0.0 | 0.0 | 0.1 | 0.2 | 0.2 | 0.2 | 0.2 | 0.1 | 0.0 | 0.0 | 0.0 | 0.0 | 0.1 | 0.2 | 0.0 | 0.1 | ||
| 1987 | 0.0 | 0.0 | 0.0 | 0.1 | 0.2 | 0.1 | 0.1 | 0.1 | 0.1 | 0.0 | 0.0 | 0.0 | 0.0 | 0.1 | 0.1 | 0.0 | 0.1 | ||
| 1986 | 0.0 | 0.0 | 0.0 | 0.2 | 0.2 | 0.2 | 0.2 | 0.3 | 0.1 | 0.0 | 0.0 | 0.0 | 0.0 | 0.1 | 0.2 | 0.0 | 0.1 | ||
| 1985 | 0.0 | 0.0 | 0.0 | 0.0 | 0.1 | 0.0 | 0.4 | 0.1 | 0.1 | 0.0 | 0.0 | 0.0 | 0.0 | 0.0 | 0.1 | 0.0 | 0.0 | ||
| 1984 | 0.0 | 0.0 | 0.0 | 0.0 | 0.0 | 0.0 | 0.0 | 0.0 | 0.0 | 0.0 | 0.0 | 0.0 | 0.0 | 0.0 | 0.0 | 0.0 | 0.0 | ||
| 1983 | 0.0 | 0.0 | 0.0 | 0.0 | 0.1 | 0.0 | 0.0 | 0.0 | 0.0 | - | 0.0 | 0.0 | 0.0 | 0.0 | 0.0 | 0.0 | 0.0 | ||
| 1982 | - | 0.0 | - | 0.0 | 0.0 | 0.0 | - | 0.0 | - | 0.0 | - | 0.0 | 0.0 | 0.0 | 0.0 | 0.0 | 0.0 | ||
Reporting rates
Reporting rate is the proportion of all surveys in which the species was present.
Reporting rate by year
This chart shows the reporting rate of Leaden Flycatcher each year between 1982 and 2017. 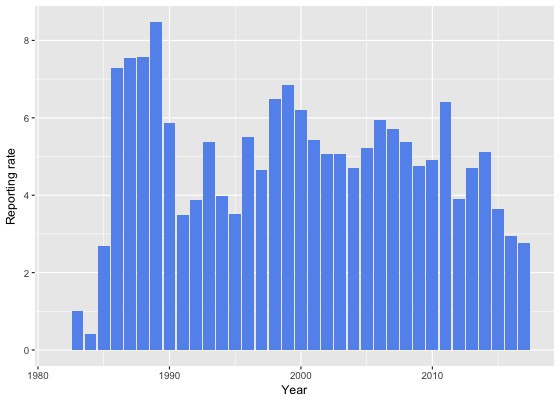
Reporting rate by month
This chart shows the reporting rate by month of Leaden Flycatcher. The blue lines show the reporting rate for the twelve months to June 2017 and the bars show the average reporting rate for the period 1982 to 2017. 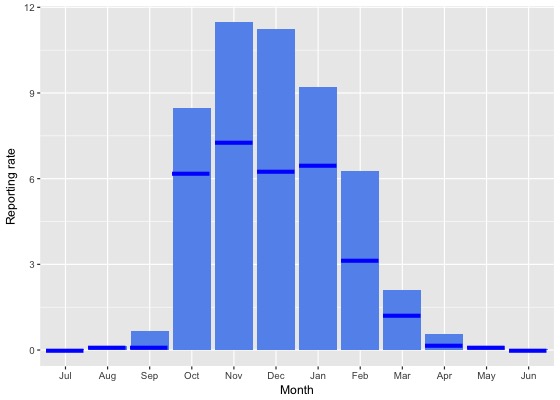
Reporting rate by season
This chart shows the seasonal reporting rate of Leaden Flycatcher. The blue lines show the seasonal reporting rate for the twelve months to June 2017 and the bars show the average seasonal reporting rate for the period 1982 to 2017. 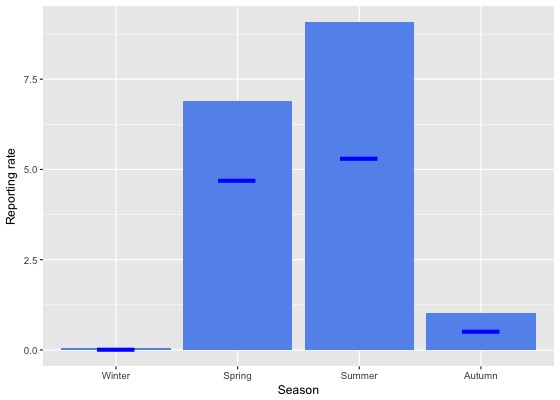
Reporting rate data
| Month | Season | ||||||||||||||||||
|---|---|---|---|---|---|---|---|---|---|---|---|---|---|---|---|---|---|---|---|
| Period | Jul | Aug | Sep | Oct | Nov | Dec | Jan | Feb | Mar | Apr | May | Jun | Winter | Spring | Summer | Autumn | All | ||
| All years | |||||||||||||||||||
| All | 0.0 | 0.1 | 0.7 | 8.5 | 11.5 | 11.2 | 9.2 | 6.3 | 2.1 | 0.6 | 0.1 | 0.0 | 0.1 | 6.9 | 9.1 | 1.0 | 4.6 | ||
| Previous years | |||||||||||||||||||
| All previous years | 0.0 | 0.1 | 0.7 | 8.8 | 12.1 | 12.0 | 9.7 | 6.9 | 2.3 | 0.6 | 0.2 | 0.0 | 0.1 | 7.2 | 9.8 | 1.1 | 4.9 | ||
| Previous 30 years | 0.0 | 0.1 | 0.8 | 8.8 | 12.2 | 12.1 | 9.7 | 6.9 | 2.2 | 0.6 | 0.1 | 0.0 | 0.1 | 7.2 | 9.8 | 1.1 | 4.9 | ||
| Previous 20 years | 0.0 | 0.1 | 0.8 | 8.6 | 11.7 | 11.7 | 9.1 | 5.7 | 1.7 | 0.5 | 0.1 | 0.0 | 0.0 | 6.9 | 9.1 | 0.9 | 4.7 | ||
| 10 year groups | |||||||||||||||||||
| [2007,2017) | 0.0 | 0.1 | 0.8 | 8.7 | 10.1 | 10.5 | 7.8 | 4.4 | 1.5 | 0.4 | 0.1 | 0.0 | 0.0 | 6.7 | 7.7 | 0.7 | 4.3 | ||
| [1997,2007) | 0.1 | 0.0 | 0.7 | 8.2 | 14.9 | 14.1 | 13.6 | 9.0 | 2.0 | 0.6 | 0.3 | 0.1 | 0.0 | 7.4 | 12.6 | 1.1 | 5.5 | ||
| [1987,1997) | 0.1 | 0.3 | 0.7 | 10.2 | 13.7 | 14.5 | 13.3 | 12.6 | 5.3 | 1.6 | 0.1 | 0.1 | 0.2 | 8.7 | 13.5 | 2.4 | 6.2 | ||
| 5 year groups | |||||||||||||||||||
| [2012,2017) | 0.0 | 0.1 | 0.3 | 7.8 | 8.8 | 9.6 | 7.3 | 3.9 | 1.5 | 0.3 | 0.0 | 0.0 | 0.0 | 5.8 | 7.0 | 0.7 | 3.8 | ||
| [2007,2012) | 0.0 | 0.4 | 1.9 | 10.3 | 13.5 | 12.3 | 9.5 | 6.5 | 1.6 | 0.7 | 0.3 | 0.0 | 0.1 | 8.6 | 10.1 | 0.9 | 5.5 | ||
| [2002,2007) | 0.0 | 0.0 | 1.0 | 8.3 | 14.5 | 13.7 | 12.9 | 7.3 | 1.8 | 0.4 | 0.3 | 0.0 | 0.0 | 7.4 | 11.9 | 1.0 | 5.2 | ||
| [1997,2002) | 0.2 | 0.0 | 0.3 | 8.1 | 15.5 | 14.5 | 14.3 | 10.7 | 2.3 | 0.8 | 0.4 | 0.1 | 0.1 | 7.4 | 13.4 | 1.3 | 6.0 | ||
| [1992,1997) | 0.3 | 0.0 | 0.3 | 8.3 | 10.4 | 12.0 | 7.2 | 9.7 | 3.4 | 0.9 | 0.0 | 0.0 | 0.1 | 6.8 | 9.5 | 1.5 | 4.4 | ||
| [1987,1992) | 0.0 | 0.5 | 1.0 | 11.2 | 15.3 | 15.6 | 16.6 | 13.7 | 6.5 | 2.0 | 0.1 | 0.1 | 0.2 | 9.7 | 15.3 | 2.9 | 7.2 | ||
| Year | |||||||||||||||||||
| 2017 | 0.0 | 0.1 | 0.1 | 6.2 | 7.3 | 6.2 | 6.5 | 3.1 | 1.2 | 0.2 | 0.1 | 0.0 | 0.0 | 4.7 | 5.3 | 0.5 | 2.8 | ||
| 2016 | 0.0 | 0.0 | 0.1 | 5.3 | 9.5 | 8.2 | 6.2 | 3.2 | 1.6 | 0.1 | 0.0 | 0.0 | 0.0 | 4.7 | 5.7 | 0.6 | 3.0 | ||
| 2015 | 0.0 | 0.0 | 0.4 | 7.7 | 8.6 | 9.4 | 6.7 | 4.1 | 1.4 | 0.4 | 0.0 | 0.0 | 0.0 | 5.7 | 6.7 | 0.7 | 3.6 | ||
| 2014 | 0.0 | 0.0 | 1.0 | 12.4 | 10.7 | 13.8 | 8.7 | 3.9 | 1.6 | 0.3 | 0.0 | 0.0 | 0.0 | 8.7 | 8.3 | 0.8 | 5.1 | ||
| 2013 | 0.0 | 0.5 | 0.2 | 9.8 | 9.0 | 8.9 | 9.9 | 4.4 | 1.4 | 0.0 | 0.0 | 0.0 | 0.1 | 6.8 | 8.2 | 0.6 | 4.7 | ||
| 2012 | 0.0 | 0.0 | 0.0 | 6.6 | 6.3 | 11.3 | 6.6 | 5.9 | 1.2 | 0.8 | 0.0 | 0.3 | 0.1 | 4.8 | 8.0 | 0.8 | 3.9 | ||
| 2011 | 0.0 | 0.0 | 1.6 | 12.7 | 17.0 | 14.9 | 11.8 | 5.9 | 3.1 | 0.9 | 0.7 | 0.0 | 0.0 | 10.3 | 11.5 | 1.6 | 6.4 | ||
| 2010 | 0.0 | 1.8 | 1.9 | 8.8 | 12.0 | 8.7 | 9.2 | 4.7 | 1.2 | 1.3 | 0.0 | 0.0 | 0.4 | 7.6 | 8.3 | 1.0 | 4.9 | ||
| 2009 | 0.0 | 0.0 | 1.5 | 9.6 | 12.9 | 10.1 | 6.7 | 4.2 | 0.9 | 0.0 | 0.0 | 0.0 | 0.0 | 8.2 | 7.4 | 0.3 | 4.8 | ||
| 2008 | 0.0 | 0.0 | 0.7 | 11.0 | 12.8 | 13.5 | 9.5 | 5.6 | 0.5 | 0.9 | 0.0 | 0.0 | 0.0 | 8.5 | 10.5 | 0.6 | 5.4 | ||
| 2007 | 0.0 | 0.0 | 4.1 | 9.0 | 13.5 | 13.1 | 8.3 | 12.2 | 1.3 | 0.4 | 0.0 | 0.0 | 0.0 | 8.4 | 11.1 | 0.7 | 5.7 | ||
| 2006 | 0.0 | 0.0 | 0.0 | 12.5 | 17.3 | 12.8 | 12.4 | 7.4 | 2.9 | 1.6 | 0.0 | 0.0 | 0.0 | 9.9 | 11.2 | 2.0 | 5.9 | ||
| 2005 | 0.0 | 0.0 | 1.1 | 7.7 | 9.7 | 20.7 | 11.3 | 8.7 | 2.6 | 0.0 | 1.0 | 0.0 | 0.0 | 5.2 | 15.7 | 1.3 | 5.2 | ||
| 2004 | 0.0 | 0.0 | 1.4 | 6.4 | 16.3 | 8.3 | 12.7 | 14.1 | 1.0 | 0.5 | 0.0 | 0.0 | 0.0 | 7.6 | 11.0 | 0.6 | 4.7 | ||
| 2003 | 0.0 | 0.0 | 0.4 | 7.3 | 16.5 | 12.7 | 15.6 | 3.8 | 0.9 | 0.0 | 0.0 | 0.0 | 0.0 | 7.9 | 10.5 | 0.4 | 5.1 | ||
| 2002 | 0.0 | 0.0 | 2.0 | 3.9 | 12.0 | 13.3 | 12.6 | 5.9 | 0.9 | 0.0 | 0.0 | 0.0 | 0.0 | 5.8 | 11.4 | 0.4 | 5.1 | ||
| 2001 | 0.0 | 0.0 | 0.0 | 6.3 | 16.5 | 15.2 | 12.0 | 13.9 | 3.0 | 0.5 | 0.0 | 0.0 | 0.0 | 5.9 | 13.9 | 1.5 | 5.4 | ||
| 2000 | 0.0 | 0.0 | 0.0 | 5.7 | 14.4 | 12.0 | 16.1 | 11.4 | 1.6 | 1.8 | 0.9 | 0.0 | 0.0 | 6.7 | 13.2 | 1.5 | 6.2 | ||
| 1999 | 0.0 | 0.0 | 1.7 | 12.6 | 18.2 | 19.4 | 16.1 | 10.7 | 2.2 | 0.5 | 0.0 | 0.5 | 0.3 | 10.5 | 15.6 | 0.9 | 6.9 | ||
| 1998 | 2.7 | 0.0 | 0.0 | 12.0 | 12.4 | 14.2 | 16.2 | 3.8 | 2.2 | 0.0 | 3.7 | 0.0 | 0.6 | 7.6 | 12.3 | 1.9 | 6.5 | ||
| 1997 | 0.0 | 0.0 | 0.0 | 6.6 | 15.4 | 12.5 | 7.8 | 3.5 | 2.5 | 0.0 | 0.0 | 0.0 | 0.0 | 7.6 | 9.0 | 0.5 | 4.6 | ||
| 1996 | 0.0 | 0.0 | 1.3 | 11.4 | 14.8 | 17.2 | 2.9 | 8.2 | 0.0 | 1.6 | 0.0 | 0.0 | 0.0 | 10.1 | 9.4 | 0.4 | 5.5 | ||
| 1995 | 0.0 | 0.0 | 0.0 | 4.9 | 5.5 | 5.7 | 8.8 | 15.9 | 4.1 | 0.8 | 0.0 | 0.0 | 0.0 | 3.7 | 9.5 | 1.7 | 3.5 | ||
| 1994 | 0.0 | 0.0 | 0.0 | 14.0 | 5.9 | 15.2 | 10.3 | 3.4 | 3.4 | 0.0 | 0.0 | 0.0 | 0.0 | 6.9 | 9.3 | 1.0 | 4.0 | ||
| 1993 | 0.0 | 0.0 | 0.0 | 10.7 | 13.6 | 19.6 | 12.2 | 6.2 | 6.2 | 1.7 | 0.0 | 0.0 | 0.0 | 8.4 | 13.4 | 2.8 | 5.4 | ||
| 1992 | 1.5 | 0.0 | 0.0 | 3.2 | 16.7 | 4.8 | 3.4 | 14.6 | 4.2 | 1.7 | 0.0 | 0.0 | 0.6 | 6.0 | 6.8 | 1.9 | 3.9 | ||
| 1991 | 0.0 | 0.0 | 0.0 | 4.9 | 5.2 | 9.5 | 10.7 | 8.0 | 4.8 | 1.7 | 1.6 | 0.0 | 0.0 | 3.5 | 9.4 | 2.7 | 3.5 | ||
| 1990 | 0.0 | 0.0 | 0.0 | 11.2 | 16.8 | 19.4 | 12.5 | 15.5 | 2.3 | 3.6 | 0.0 | 1.3 | 0.2 | 9.7 | 15.8 | 2.0 | 5.9 | ||
| 1989 | 0.0 | 1.3 | 2.2 | 17.7 | 17.2 | 15.7 | 21.3 | 15.5 | 3.9 | 2.1 | 0.0 | 0.0 | 0.5 | 12.4 | 17.3 | 2.1 | 8.5 | ||
| 1988 | 0.0 | 0.4 | 1.7 | 7.4 | 16.3 | 16.9 | 17.1 | 18.3 | 10.4 | 3.2 | 0.0 | 0.0 | 0.1 | 9.5 | 17.4 | 4.6 | 7.6 | ||
| 1987 | 0.0 | 0.0 | 0.0 | 10.9 | 15.8 | 15.2 | 14.9 | 9.6 | 7.2 | 0.4 | 0.0 | 0.0 | 0.0 | 9.7 | 13.0 | 2.3 | 7.6 | ||
| 1986 | 0.0 | 0.0 | 0.0 | 11.1 | 21.3 | 11.8 | 17.4 | 19.4 | 6.5 | 0.0 | 3.4 | 0.0 | 0.0 | 10.3 | 16.1 | 2.7 | 7.3 | ||
| 1985 | 0.0 | 0.0 | 0.0 | 2.3 | 5.3 | 1.7 | 12.5 | 17.6 | 9.1 | 0.0 | 0.0 | 0.0 | 0.0 | 2.6 | 5.9 | 2.5 | 2.7 | ||
| 1984 | 0.0 | 0.0 | 0.0 | 0.0 | 0.0 | 0.0 | 0.0 | 0.0 | 3.7 | 0.0 | 0.0 | 0.0 | 0.0 | 0.0 | 0.0 | 1.1 | 0.4 | ||
| 1983 | 0.0 | 0.0 | 0.0 | 0.0 | 11.1 | 0.0 | 0.0 | 0.0 | 0.0 | - | 0.0 | 0.0 | 0.0 | 3.7 | 0.0 | 0.0 | 1.0 | ||
| 1982 | - | 0.0 | - | 0.0 | 0.0 | 0.0 | - | 0.0 | - | 0.0 | - | 0.0 | 0.0 | 0.0 | 0.0 | 0.0 | 0.0 | ||
Breeding data
Breeding records by month
Number of breeding records by breeding code and month, 2017 and all years| Breeding code | Jul | Aug | Sep | Oct | Nov | Dec | Jan | Feb | Mar | Apr | May | Jun |
|---|---|---|---|---|---|---|---|---|---|---|---|---|
| 2017 | ||||||||||||
| Breeding (BLA code) | 0 | 0 | 0 | 0 | 0 | 0 | 0 | 0 | 0 | 0 | 0 | 0 |
| Carrying Food | 0 | 0 | 0 | 0 | 0 | 0 | 1 | 0 | 0 | 0 | 0 | 0 |
| Copulating | 0 | 0 | 0 | 0 | 0 | 0 | 0 | 0 | 0 | 0 | 0 | 0 |
| Display | 0 | 0 | 0 | 1 | 2 | 0 | 0 | 0 | 0 | 0 | 0 | 0 |
| Dependent young | 0 | 0 | 0 | 0 | 0 | 3 | 6 | 1 | 0 | 0 | 0 | 0 |
| Faecal sac | 0 | 0 | 0 | 0 | 0 | 0 | 0 | 0 | 0 | 0 | 0 | 0 |
| Inspecting hollow | 0 | 0 | 0 | 0 | 0 | 0 | 0 | 0 | 0 | 0 | 0 | 0 |
| Nest building | 0 | 0 | 0 | 1 | 3 | 2 | 0 | 0 | 0 | 0 | 0 | 0 |
| Nest with eggs | 0 | 0 | 0 | 0 | 0 | 1 | 1 | 0 | 0 | 0 | 0 | 0 |
| Nest with young | 0 | 0 | 0 | 0 | 0 | 0 | 1 | 0 | 0 | 0 | 0 | 0 |
| On/leaving nest | 0 | 0 | 0 | 3 | 2 | 7 | 2 | 0 | 0 | 0 | 0 | 0 |
| All years | ||||||||||||
| Breeding (BLA code) | 0 | 0 | 0 | 0 | 2 | 6 | 1 | 0 | 0 | 0 | 0 | 0 |
| Carrying Food | 0 | 0 | 0 | 3 | 2 | 4 | 6 | 1 | 0 | 0 | 0 | 0 |
| Copulating | 0 | 0 | 0 | 1 | 0 | 0 | 0 | 0 | 0 | 0 | 0 | 0 |
| Display | 0 | 0 | 0 | 7 | 2 | 0 | 0 | 0 | 0 | 0 | 0 | 0 |
| Dependent young | 0 | 0 | 0 | 1 | 3 | 28 | 47 | 22 | 2 | 0 | 0 | 0 |
| Faecal sac | 0 | 0 | 0 | 0 | 0 | 0 | 0 | 0 | 0 | 0 | 0 | 0 |
| Inspecting hollow | 0 | 0 | 0 | 0 | 0 | 0 | 0 | 0 | 0 | 0 | 0 | 0 |
| Nest building | 0 | 0 | 0 | 28 | 45 | 15 | 5 | 0 | 0 | 0 | 0 | 0 |
| Nest with eggs | 0 | 0 | 0 | 0 | 8 | 8 | 3 | 0 | 0 | 0 | 0 | 0 |
| Nest with young | 0 | 0 | 0 | 0 | 3 | 12 | 10 | 2 | 0 | 0 | 0 | 0 |
| On/leaving nest | 0 | 0 | 0 | 15 | 40 | 35 | 12 | 2 | 0 | 0 | 0 | 0 |
Breeding records by year
Average number of breeding records per period by breeding code| Period | Breeding (BLA code) | Carrying Food | Copulating | Display | Dependent young | Faecal sac | Inspecting hollow | Nest building | Nest with eggs | Nest with young | On/leaving nest |
|---|---|---|---|---|---|---|---|---|---|---|---|
| All years | |||||||||||
| All | 0.2 | 0.4 | 0.0 | 0.2 | 2.9 | 0.0 | 0.0 | 2.6 | 0.5 | 0.8 | 2.9 |
| Previous years | |||||||||||
| All previous years | 0.3 | 0.4 | 0.0 | 0.2 | 2.7 | 0.0 | 0.0 | 2.5 | 0.5 | 0.7 | 2.6 |
| Previous 30 years | 0.3 | 0.5 | 0.0 | 0.2 | 3.1 | 0.0 | 0.0 | 2.9 | 0.6 | 0.9 | 3.0 |
| Previous 20 years | 0.5 | 0.7 | 0.0 | 0.3 | 3.1 | 0.0 | 0.0 | 3.0 | 0.2 | 0.9 | 4.0 |
| 10 year groups | |||||||||||
| [2007,2017) | 0.5 | 0.5 | 0.0 | 0.5 | 4.3 | 0.0 | 0.0 | 4.4 | 0.3 | 1.4 | 6.0 |
| [1997,2007) | 0.4 | 0.8 | 0.1 | 0.1 | 1.9 | 0.0 | 0.0 | 1.5 | 0.1 | 0.4 | 2.0 |
| [1987,1997) | 0.0 | 0.2 | 0.0 | 0.0 | 3.0 | 0.0 | 0.0 | 2.8 | 1.3 | 0.8 | 0.9 |
| 5 year groups | |||||||||||
| [2012,2017) | 0.6 | 0.2 | 0.0 | 0.6 | 5.8 | 0.0 | 0.0 | 5.2 | 0.4 | 2.0 | 8.6 |
| [2007,2012) | 0.4 | 0.8 | 0.0 | 0.4 | 2.8 | 0.0 | 0.0 | 3.6 | 0.2 | 0.8 | 3.4 |
| [2002,2007) | 0.2 | 1.0 | 0.2 | 0.0 | 1.4 | 0.0 | 0.0 | 1.8 | 0.0 | 0.2 | 1.8 |
| [1997,2002) | 0.6 | 0.6 | 0.0 | 0.2 | 2.4 | 0.0 | 0.0 | 1.2 | 0.2 | 0.6 | 2.2 |
| [1992,1997) | 0.0 | 0.2 | 0.0 | 0.0 | 1.0 | 0.0 | 0.0 | 1.0 | 0.4 | 0.2 | 1.6 |
| [1987,1992) | 0.0 | 0.2 | 0.0 | 0.0 | 5.0 | 0.0 | 0.0 | 4.6 | 2.2 | 1.4 | 0.2 |
| Year | |||||||||||
| 2017 | 0.0 | 1.0 | 0.0 | 3.0 | 10.0 | 0.0 | 0.0 | 6.0 | 2.0 | 1.0 | 14.0 |
| 2016 | 2.0 | 0.0 | 0.0 | 0.0 | 11.0 | 0.0 | 0.0 | 7.0 | 1.0 | 8.0 | 18.0 |
| 2015 | 1.0 | 1.0 | 0.0 | 0.0 | 8.0 | 0.0 | 0.0 | 7.0 | 0.0 | 0.0 | 11.0 |
| 2014 | 0.0 | 0.0 | 0.0 | 0.0 | 4.0 | 0.0 | 0.0 | 5.0 | 0.0 | 0.0 | 7.0 |
| 2013 | 0.0 | 0.0 | 0.0 | 2.0 | 4.0 | 0.0 | 0.0 | 3.0 | 0.0 | 2.0 | 3.0 |
| 2012 | 0.0 | 0.0 | 0.0 | 1.0 | 2.0 | 0.0 | 0.0 | 4.0 | 1.0 | 0.0 | 4.0 |
| 2011 | 1.0 | 1.0 | 0.0 | 1.0 | 4.0 | 0.0 | 0.0 | 8.0 | 1.0 | 3.0 | 5.0 |
| 2010 | 0.0 | 2.0 | 0.0 | 0.0 | 3.0 | 0.0 | 0.0 | 2.0 | 0.0 | 0.0 | 0.0 |
| 2009 | 0.0 | 0.0 | 0.0 | 1.0 | 2.0 | 0.0 | 0.0 | 1.0 | 0.0 | 0.0 | 6.0 |
| 2008 | 0.0 | 0.0 | 0.0 | 0.0 | 2.0 | 0.0 | 0.0 | 5.0 | 0.0 | 0.0 | 3.0 |
| 2007 | 1.0 | 1.0 | 0.0 | 0.0 | 3.0 | 0.0 | 0.0 | 2.0 | 0.0 | 1.0 | 3.0 |
| 2006 | 0.0 | 1.0 | 0.0 | 0.0 | 4.0 | 0.0 | 0.0 | 5.0 | 0.0 | 0.0 | 6.0 |
| 2005 | 0.0 | 2.0 | 0.0 | 0.0 | 2.0 | 0.0 | 0.0 | 3.0 | 0.0 | 0.0 | 1.0 |
| 2004 | 0.0 | 0.0 | 1.0 | 0.0 | 0.0 | 0.0 | 0.0 | 0.0 | 0.0 | 0.0 | 1.0 |
| 2003 | 0.0 | 1.0 | 0.0 | 0.0 | 1.0 | 0.0 | 0.0 | 0.0 | 0.0 | 0.0 | 1.0 |
| 2002 | 1.0 | 1.0 | 0.0 | 0.0 | 0.0 | 0.0 | 0.0 | 1.0 | 0.0 | 1.0 | 0.0 |
| 2001 | 0.0 | 0.0 | 0.0 | 0.0 | 5.0 | 0.0 | 0.0 | 1.0 | 1.0 | 1.0 | 1.0 |
| 2000 | 2.0 | 0.0 | 0.0 | 0.0 | 5.0 | 0.0 | 0.0 | 2.0 | 0.0 | 0.0 | 4.0 |
| 1999 | 1.0 | 3.0 | 0.0 | 1.0 | 0.0 | 0.0 | 0.0 | 0.0 | 0.0 | 0.0 | 4.0 |
| 1998 | 0.0 | 0.0 | 0.0 | 0.0 | 2.0 | 0.0 | 0.0 | 1.0 | 0.0 | 1.0 | 1.0 |
| 1997 | 0.0 | 0.0 | 0.0 | 0.0 | 0.0 | 0.0 | 0.0 | 2.0 | 0.0 | 1.0 | 1.0 |
| 1996 | 0.0 | 1.0 | 0.0 | 0.0 | 1.0 | 0.0 | 0.0 | 1.0 | 2.0 | 0.0 | 3.0 |
| 1995 | 0.0 | 0.0 | 0.0 | 0.0 | 1.0 | 0.0 | 0.0 | 0.0 | 0.0 | 0.0 | 3.0 |
| 1994 | 0.0 | 0.0 | 0.0 | 0.0 | 1.0 | 0.0 | 0.0 | 0.0 | 0.0 | 1.0 | 1.0 |
| 1993 | 0.0 | 0.0 | 0.0 | 0.0 | 1.0 | 0.0 | 0.0 | 2.0 | 0.0 | 0.0 | 0.0 |
| 1992 | 0.0 | 0.0 | 0.0 | 0.0 | 1.0 | 0.0 | 0.0 | 2.0 | 0.0 | 0.0 | 1.0 |
| 1991 | 0.0 | 0.0 | 0.0 | 0.0 | 1.0 | 0.0 | 0.0 | 2.0 | 0.0 | 1.0 | 0.0 |
| 1990 | 0.0 | 0.0 | 0.0 | 0.0 | 0.0 | 0.0 | 0.0 | 2.0 | 2.0 | 0.0 | 1.0 |
| 1989 | 0.0 | 0.0 | 0.0 | 0.0 | 7.0 | 0.0 | 0.0 | 8.0 | 1.0 | 2.0 | 0.0 |
| 1988 | 0.0 | 1.0 | 0.0 | 0.0 | 9.0 | 0.0 | 0.0 | 7.0 | 4.0 | 2.0 | 0.0 |
| 1987 | 0.0 | 0.0 | 0.0 | 0.0 | 8.0 | 0.0 | 0.0 | 4.0 | 4.0 | 2.0 | 0.0 |
| 1986 | 0.0 | 0.0 | 0.0 | 0.0 | 1.0 | 0.0 | 0.0 | 0.0 | 0.0 | 0.0 | 1.0 |
| 1985 | 0.0 | 0.0 | 0.0 | 0.0 | 0.0 | 0.0 | 0.0 | 0.0 | 0.0 | 0.0 | 0.0 |
| 1984 | 0.0 | 0.0 | 0.0 | 0.0 | 0.0 | 0.0 | 0.0 | 0.0 | 0.0 | 0.0 | 0.0 |
| 1983 | 0.0 | 0.0 | 0.0 | 0.0 | 0.0 | 0.0 | 0.0 | 0.0 | 0.0 | 0.0 | 0.0 |
| 1982 | 0.0 | 0.0 | 0.0 | 0.0 | 0.0 | 0.0 | 0.0 | 0.0 | 0.0 | 0.0 | 0.0 |
Distribution map
Distribution - 2017
This map shows the observed distribution of the Leaden Flycatcher for 2017.
The red circles are the grid cells where Leaden Flycatcher have been reported.
The transparency of the red circles indicate how many surveys sheets were submitted for that grid cell; the darker the red the more reliable the data. Of the 315 grid cells with reports, 83 had only one sheet; an example is grid number A11.
The size of the circle represents the reporting rate. The maximum reporting rate for Leaden Flycatcher was 57.1% (eg grid number P7) and the minimum was 0.1% (eg grid number J14). 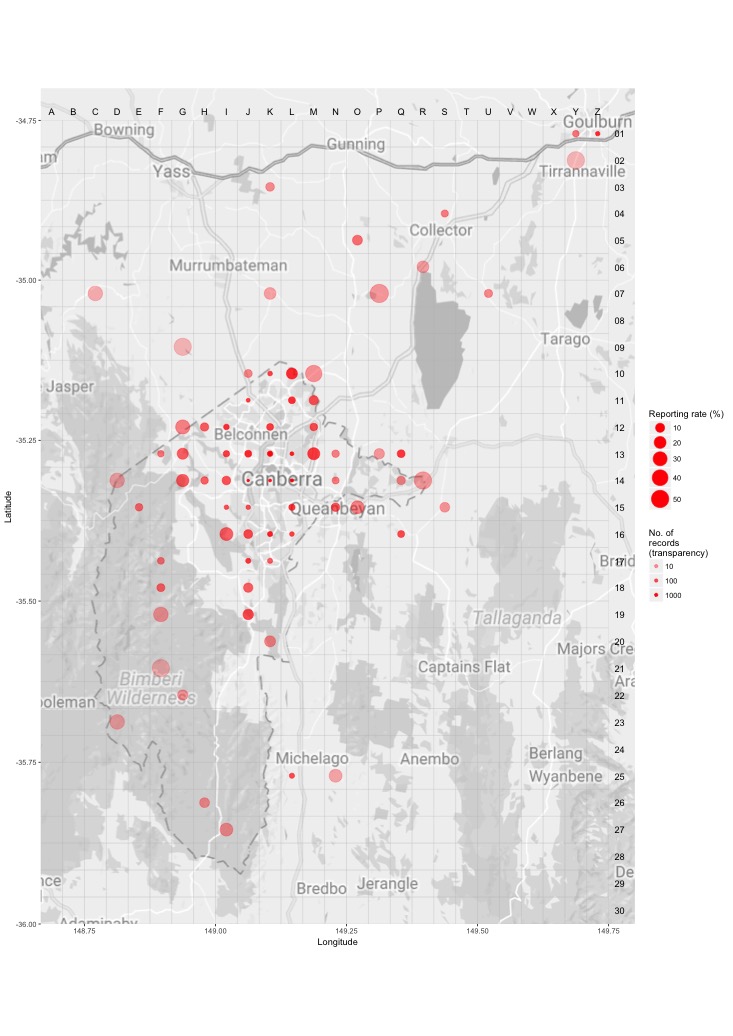
Distribution - all years
This map shows the observed distribution of the Leaden Flycatcher for all years.
The red circles are the grid cells where Leaden Flycatcher have been reported.
The transparency of the red circles indicate how many surveys sheets were submitted for that grid cell; the darker the red the more reliable the data. Of the 703 grid cells with reports, 55 had only one sheet; an example is grid number A5.
The size of the circle represents the reporting rate. The maximum reporting rate for Leaden Flycatcher was 100.0% (eg grid number A5) and the minimum was 0.1% (eg grid number L12). 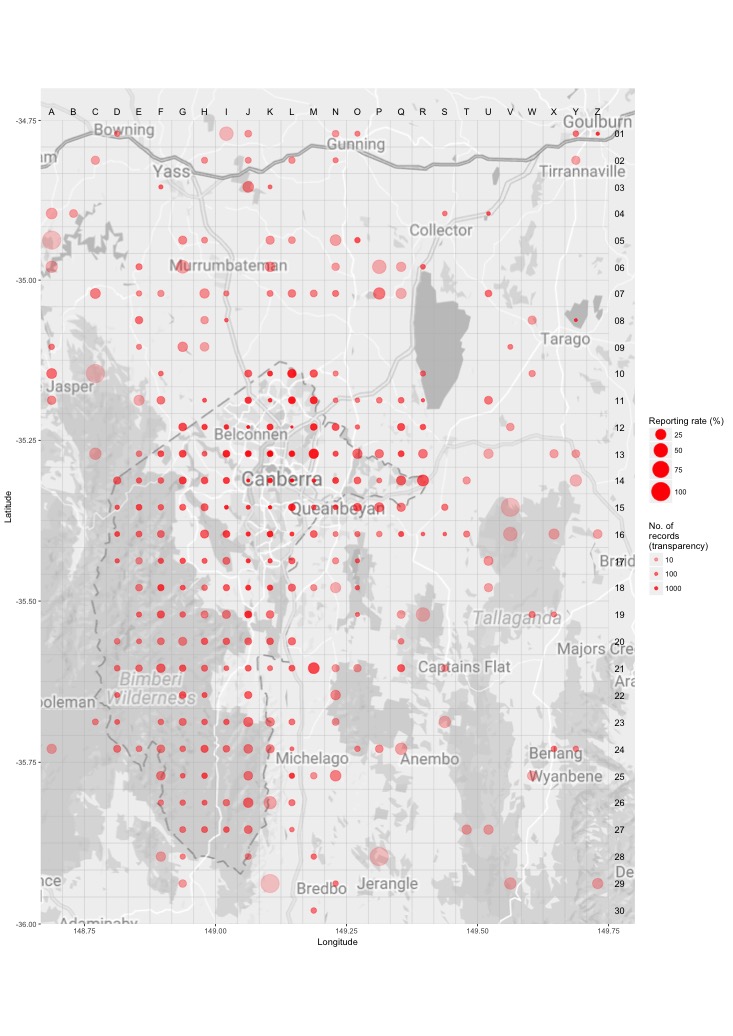
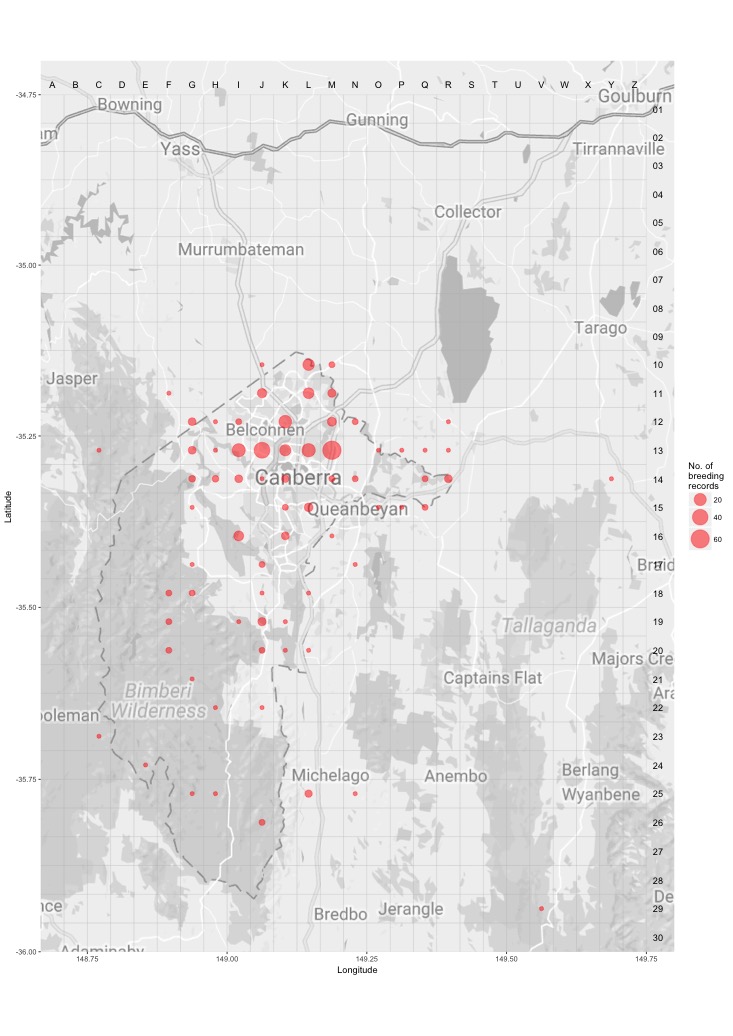
Breeding map
Breeding - 2017
This map shows the breeding distribution of the Leaden Flycatcher for 2017.
The red circles are the grid cells where breeding activity for Leaden Flycatcher have been reported.
The size of the circle represents the number of reports. 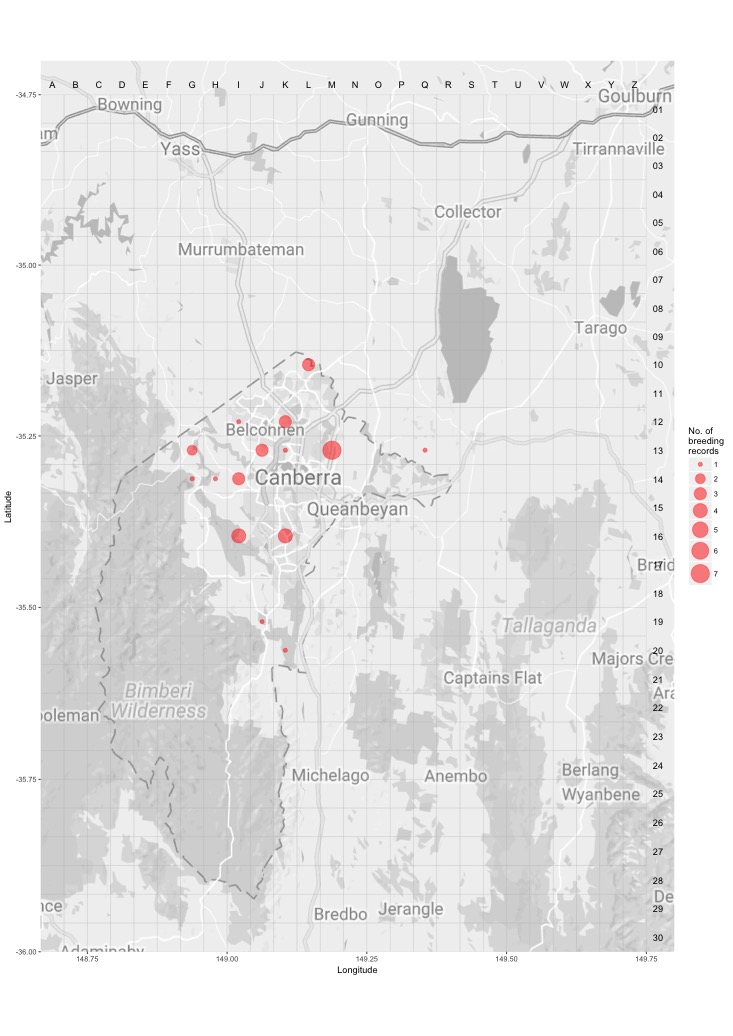
Breeding - all years
This map shows the breeding distribution of the Leaden Flycatcher for all years.
The red circles are the grid cells where breeding activity for Leaden Flycatcher have been reported.
The size of the circle represents the number of reports.